


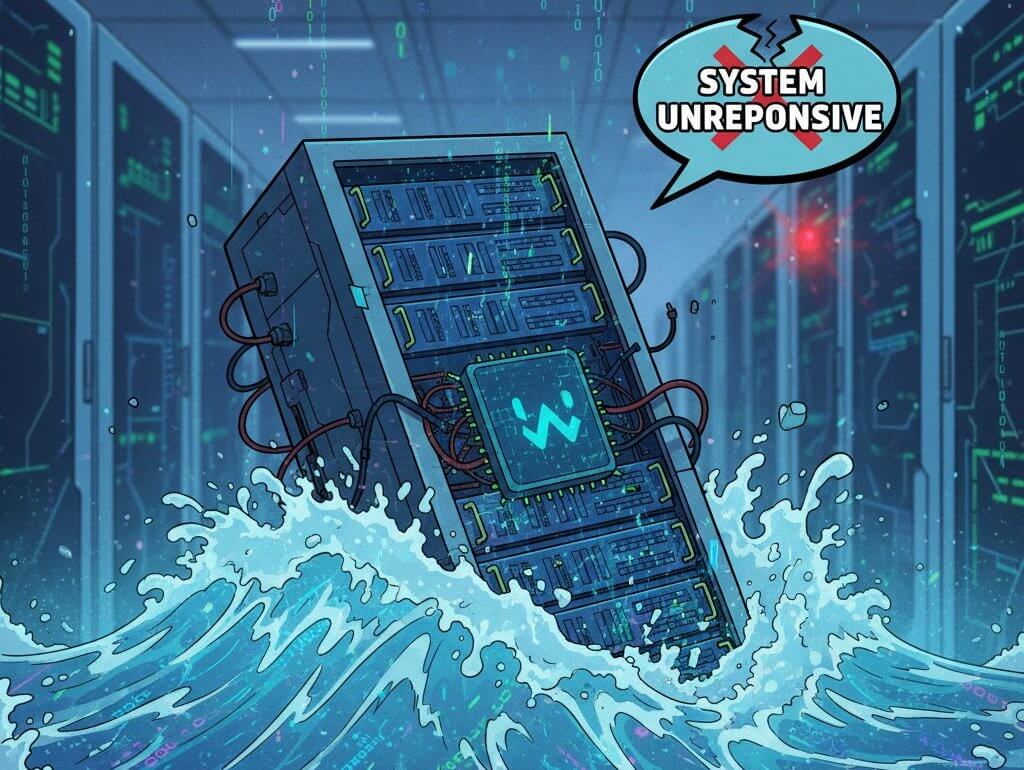

Every administrator knows the feeling. You glance at your SIEM system’s dashboard, expecting a stream of alerts, but instead, there’s… silence. The dashboards aren’t refreshing; the last events are from hours ago. Your first thought? An outage. You log into the server, type systemctl status wazuh-manager, and see the reassuring green text: active (running).
You’ve just fallen into the “silent failure” trap – one of the most frustrating problems in systems management. The service is running, but it isn’t working. In this article, we’ll walk step-by-step through my recent battle with Wazuh after it stopped processing data, even though everything seemed fine on the surface. It’s a story of false leads, a crucial discovery, and a performance pitfall that many administrators forget when deploying Wazuh on VPS servers.
Step 1: Confirming the Problem – Where’s the Data Stuck?
If the manager service is running, the problem must lie within the data processing pipeline. The first and most crucial step is to check if the manager is generating any alerts at all.
# Check the timestamp of the last alert
tail -1 /var/ossec/logs/alerts/alerts.json
The result was brutal – the last alert was from the previous day. This confirmed the problem was with the manager itself or its communication with the agents.
The next step is to look under the bonnet of the analysis engine. Wazuh’s state files are a gold mine of information:
cat /var/ossec/var/run/wazuh-analysisd.state
And here was the first smoking gun:
events_dropped='169742'event_queue_usage='1.00'
Almost 170,000 dropped events and a queue that was 100% full. The manager wasn’t just idle; it was drowning under a flood of events it couldn’t process. The diagnosis: a classic event storm.
Step 2: Hunting the Culprit – False Leads
Logic suggested that one of the agents or a local log file had to be generating a massive amount of traffic. The hunt began:
- Analysing Archives: Attempts to parse
archives.logto find a “noisy” agent or file proved fruitless. The log formats were too varied. - Reviewing Configuration: I checked the
ossec.conffile for monitored files (<localfile>) and analysed their sizes. Nothing. No file was suspiciously large. The NGINX logs, while active, couldn’t explain a paralysis on this scale.
I felt like I was going around in circles. The problem had to be somewhere else.
Step 3: The Breakthrough – The Power of journald
I returned to the configuration and noticed one, often overlooked, line:
<localfile>
  <log_format>journald</log_format>
  <location>journald</location>
</localfile>
Wazuh was pulling logs directly from the systemd journal. This meant the source of the problem could be any service on the server, not necessarily one I was consciously monitoring.
This was a bullseye. I used journalctl to go back in time to the exact moment of the failure:
journalctl --since "2025-09-13 17:25:00" --until "2025-09-13 17:35:00"
The result was unequivocal. My screen was flooded with a wave of identical errors, repeating thousands of times per second:
Sep 13 17:28:02 WazuhSecurity wazuh-analysisd[2421035]: wazuh-db: ERROR: SQL error: 'disk I/O error'
Sep 13 17:28:02 WazuhSecurity wazuh-analysisd[2421035]: wazuh-db: ERROR: Could not execute SQL query.
It all started with a single line, just before the avalanche of errors:
Sep 13 17:28:02 WazuhSecurity wazuh-analysisd[...]: wazuh-modulesd:vulnerability-detector: INFO: Starting vulnerability scan.
I had found the culprit. The Vulnerability Detector (vulnerability-detector) initiated an operation so disk-intensive that the drive stopped responding. The I/O error was written to journald, from where Wazuh’s logcollector immediately read it and sent it to analysisd. The analysis engine, trying to process the error, likely generated more disk operations, creating a catastrophic feedback loop that choked the entire system in seconds.
The Final Diagnosis: VPS and Hidden IOPS Limits
But why would an SSD on a VPS server report I/O errors?
- Disk space? There was plenty (only 26% used).
- Hardware failure? The kernel logs (
dmesg) were clean.
The real cause lay in the business model of shared hosting. My server, despite having an “SSD”, is on a basic Cloud VPS plan. In such environments, providers limit the input/output operations per second (IOPS) to ensure a fair distribution of resources.
Wazuh’s Vulnerability Detector is an enterprise-grade tool. Its demand for IOPS during a scan far exceeded the limits allocated to my VPS. My disk wasn’t faulty or full – it was simply too slow for the task.
The Recovery Plan: How to Bring Wazuh Back to Life
1. The Immediate Workaround
To restore the core functionality (collecting alerts) immediately, I had to sacrifice the culprit. I disabled the vulnerability scanner in the /var/ossec/etc/ossec.conf file:
<vulnerability-detector>
  <enabled>no</enabled>  <!-- Change 'yes' to 'no' -->
  ...
</vulnerability-detector>
After restarting the manager (systemctl restart wazuh-manager), the system came back to life. The queues cleared, and alerts from agents started flowing in normally.
2. The Long-Term Solution
The only real solution is to provide adequate resources. There are two options:
- Upgrade the VPS plan to one with a guaranteed, high number of IOPS.
- Migrate to a dedicated server or to a cloud provider (like AWS, GCP, Azure) where I have full control over disk performance.
Key Takeaways
This story is a valuable reminder of a few truths:
active (running)does not mean “working correctly”. Always trust internal metrics, not just the service status.events_droppedis your most important indicator. If this value is rising, you have a serious performance problem.- Beware the VPS performance trap. An “SSD” in the package name doesn’t guarantee the performance needed for professional security tools. Always check the IOPS limits.
- Diagnostics is a process of elimination. Sometimes you have to follow a few false leads to get to the root cause.
I hope my experience helps you to diagnose similar “silent failures” more quickly in the future.
Leave a Reply